September 3, 2025 - By: Victor Tang
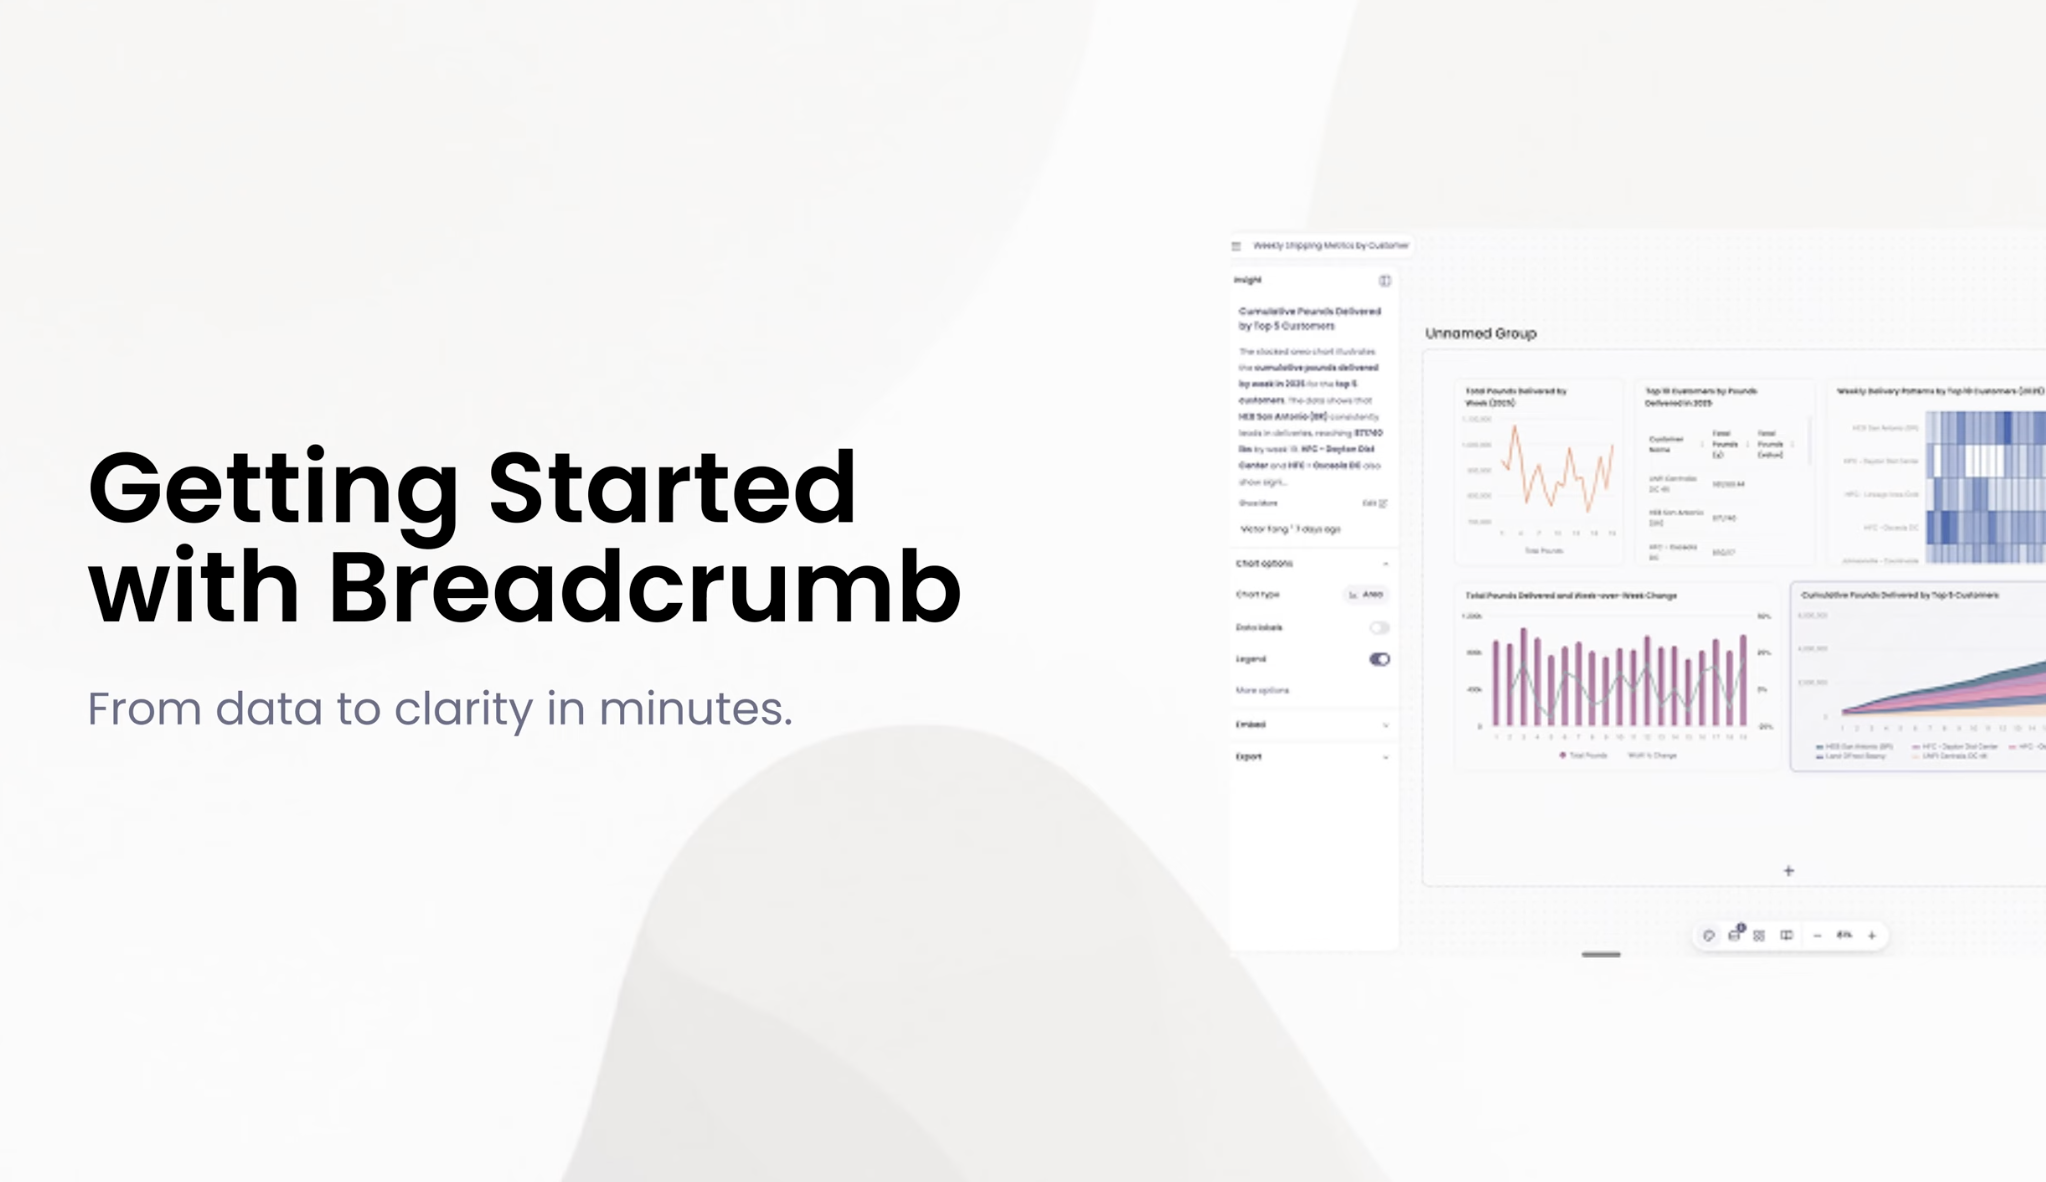
Getting started with Breadcrumb (Video Guide)
Watch our complete feature walkthrough showing how Breadcrumb transforms data analysis from static reports to dynamic, AI-powered insights. See auto-generated dashboards, seamless data combining, and interactive exploration in action.
Static reports and disconnected dashboards slow down decision-making. That’s why we built Breadcrumb—an AI-native analytics platform designed for business users to get from question → insight → action in minutes, without relying on data teams.
In our latest full feature walkthrough video, we show you exactly how Breadcrumb works in action—combining data, auto-generating dashboards, diving deeper into insights, and more.
Combine Spreadsheet Data Seamlessly
The demo starts by showing how easy it is to bring data together. Whether it’s multiple spreadsheets or different sources, Breadcrumb quickly unifies them so you don’t have to worry about messy joins or manual prep.
Auto-Generate Dashboards in Seconds
Once the data is loaded, Breadcrumb’s AI automatically creates a dashboard—so you’re not staring at a blank canvas. You get a head start with meaningful charts and metrics tailored to your dataset.
Iterate and Dive Deeper into Insights
Dashboards aren’t static here. You can ask questions, refine metrics, and drill into trends instantly. Each iteration helps uncover the “why” behind the numbers, not just the “what.”
Change Chart Types with a Click
Visualization flexibility matters. Breadcrumb makes it simple to switch chart types—bar, line, pie, and more—so you can present data in the clearest, most impactful way.
Create Multiple Widgets Simultaneously
Need several views at once? No problem. Breadcrumb lets you spin up multiple widgets in parallel, so you can compare and explore different aspects of your data side by side.
Introducing Groups
One of the newest features in the walkthrough: Groups. This lets you organize widgets and insights into collections, making it easy to structure dashboards around themes—like marketing, sales, or operations—and collaborate with your team.
Why This Matters
This walkthrough isn’t just a product tour—it’s a proof point for how analytics should work in 2025:
- No more waiting for analysts to build dashboards
- No more copy-pasting numbers into slides
- No more dead-end static reports
Breadcrumb empowers business teams to explore, iterate, and share insights at the speed of conversation.
With Breadcrumb, every stakeholder—from marketers to sponsors to operators—can turn raw data into actionable insights instantly. This walkthrough shows the full power of what’s possible today, and it’s only the beginning.
Ready to Transform Your Data Analysis?
Experience the future of analytics for yourself. Try Breadcrumb today and see how AI-powered insights can accelerate your decision-making.
No complex setup. No technical skills required. Just connect your data and start getting answers.