July 31, 2025 - By: Victor Tang
The Complete Guide to Data Analytics for Live Events: Industry Deep Dive
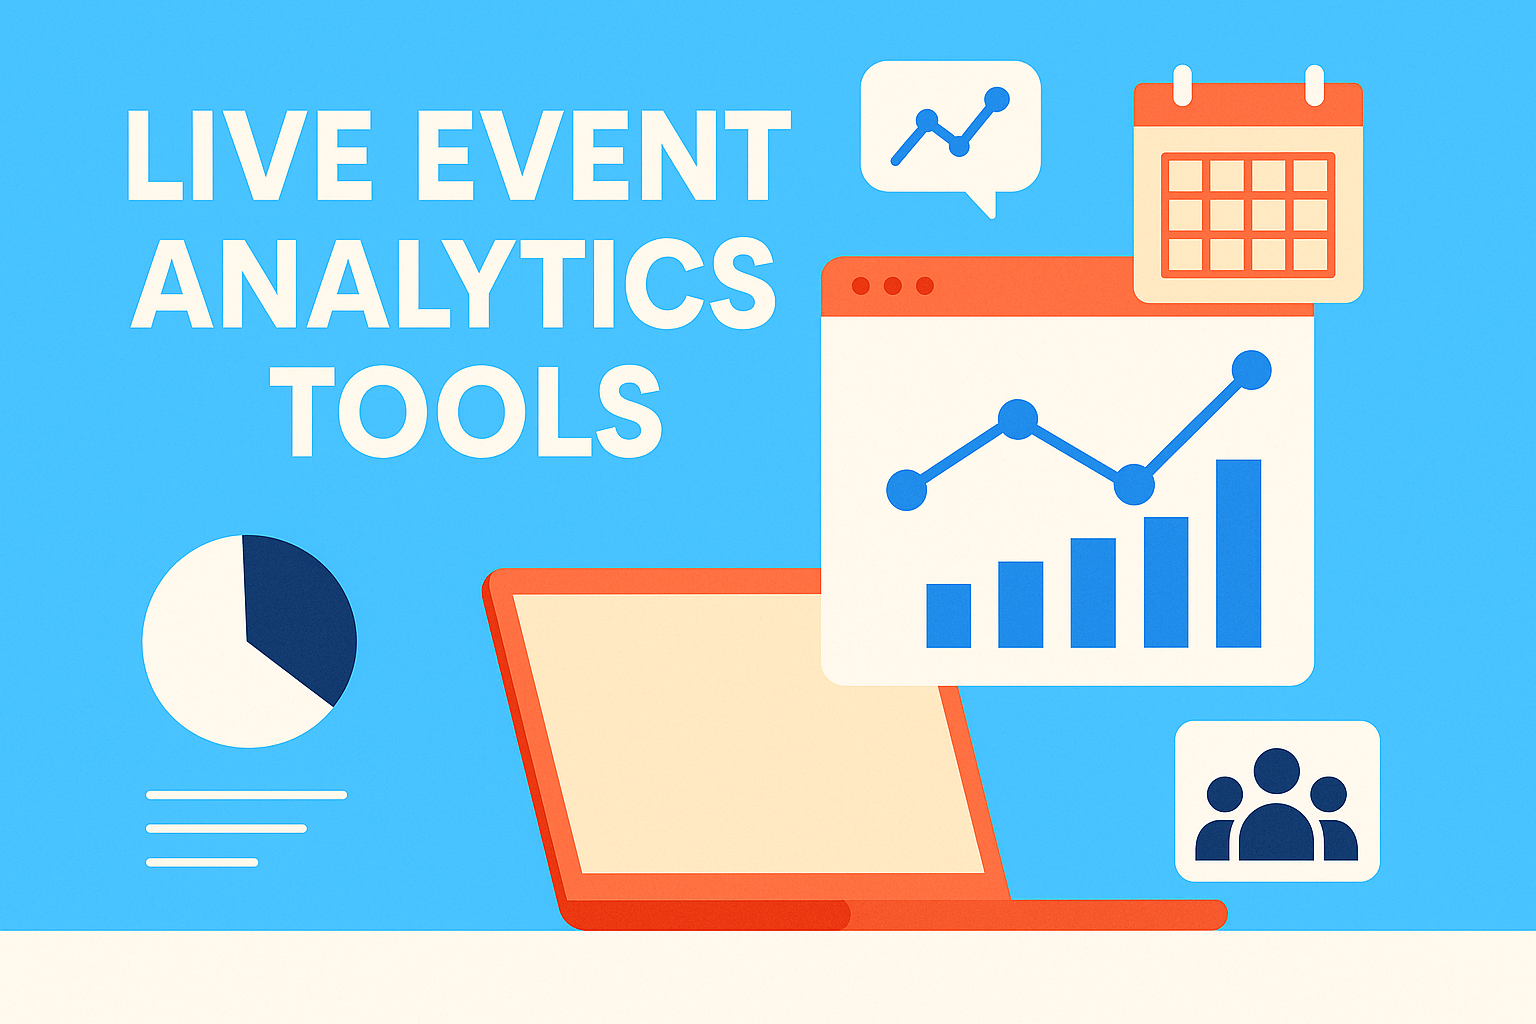
Explore the evolving landscape of data analytics in live events, from traditional tools to AI-powered solutions. Discover how modern analytics are transforming event management, attendee engagement, and ROI measurement.
Introduction: The Data Revolution in Live Events
The live events industry is experiencing a seismic shift. What was once a business driven by intuition and experience is now powered by data—lots of it. From music festivals and sports events to conferences and trade shows, event organizers are leveraging sophisticated analytics to make informed decisions, optimize experiences, and maximize ROI.
In 2024, the global event analytics market reached $2.8 billion, with projections showing 15.3% annual growth through 2030. This growth isn’t just about collecting more data—it’s about transforming how events are planned, executed, and measured.
The Evolution of Event Analytics
From Spreadsheets to Real-Time Intelligence
Just a decade ago, event analytics meant manual data entry, Excel spreadsheets, and post-event reports that arrived weeks after the curtain closed. Today, we’re seeing:
- Real-time dashboards updating every 30 seconds
- Predictive analytics forecasting attendance and revenue
- AI-powered insights identifying patterns humans might miss
- Automated reporting delivered to stakeholders instantly
The Data Sources Explosion
Modern events generate data from dozens of sources:
- Ticketing systems (Eventbrite, Ticketmaster, SeatGeek)
- Point-of-sale systems (Square, Toast, Lightspeed)
- RFID and NFC technology for attendee tracking
- Wi-Fi analytics showing movement patterns
- Social media monitoring (mentions, sentiment, reach)
- Mobile apps with engagement metrics
- IoT sensors for crowd density and flow
- Video analytics for dwell time and engagement
Popular Analytics Tools in the Live Events Industry
1. Traditional Business Intelligence Platforms
Tableau
Market Position: Enterprise BI leader Strengths:
- Powerful visualization capabilities
- Extensive data source connectors
- Advanced analytics features
- Strong community and support
Limitations:
- High cost ($70-70,000+ annually)
- Steep learning curve
- Requires dedicated analysts
- Limited real-time capabilities
Best For: Large event companies with dedicated data teams
Power BI
Market Position: Microsoft’s BI solution Strengths:
- Integration with Microsoft ecosystem
- Competitive pricing ($9.99-20/user/month)
- Good visualization options
- Familiar interface for Office users
Limitations:
- Limited advanced analytics
- Performance issues with large datasets
- Complex data modeling requirements
- Limited real-time features
Best For: Mid-size organizations already using Microsoft products
2. Event-Specific Analytics Platforms
Eventbrite Analytics
Market Position: Built-in analytics for Eventbrite events Strengths:
- Seamless integration with ticketing
- Real-time sales tracking
- Audience insights
- Marketing performance metrics
Limitations:
- Limited to Eventbrite data
- Basic visualization options
- No external data integration
- Limited customization
Best For: Small to medium events using Eventbrite
Cvent Analytics
Market Position: Enterprise event management analytics Strengths:
- Comprehensive event lifecycle tracking
- Advanced reporting capabilities
- Integration with Cvent’s full suite
- ROI measurement tools
Limitations:
- High cost
- Complex setup
- Limited flexibility
- Vendor lock-in
Best For: Large corporate events and conferences
3. Real-Time Analytics Solutions
Google Analytics 4 (GA4)
Market Position: Web and app analytics leader Strengths:
- Free tier available
- Real-time data
- Cross-platform tracking
- Machine learning insights
Limitations:
- Limited offline event tracking
- Complex setup for events
- Privacy concerns
- Learning curve for advanced features
Best For: Events with significant digital components
Mixpanel
Market Position: Product analytics for digital experiences Strengths:
- Real-time event tracking
- User journey analysis
- A/B testing capabilities
- Mobile app analytics
Limitations:
- Primarily digital-focused
- Limited physical event integration
- Cost scales with usage
- Requires technical setup
Best For: Events with mobile apps or digital experiences
4. Specialized Event Analytics Tools
CrowdCompass (Cvent)
Market Position: Mobile event app with analytics Strengths:
- Built-in engagement tracking
- Real-time attendee insights
- Session analytics
- Networking metrics
Limitations:
- Limited to app users
- Basic reporting
- High cost for small events
- Vendor-specific
Best For: Large conferences and trade shows
Bizzabo
Market Position: All-in-one event platform with analytics Strengths:
- Comprehensive event management
- Built-in analytics
- Integration capabilities
- User-friendly interface
Limitations:
- Platform lock-in
- Limited customization
- High cost
- Basic advanced analytics
Best For: Mid-size events needing complete solutions
The Current State: Challenges and Pain Points
Data Silos and Integration Issues
Despite the proliferation of tools, most event organizers face significant challenges:
The Integration Problem:
- 73% of event organizers use 5+ different systems
- Only 23% have fully integrated data workflows
- Average time to generate reports: 3-5 days
- 68% report data inconsistencies across systems
The Skills Gap:
- 85% of event teams lack dedicated data analysts
- 62% rely on manual data compilation
- 41% don’t trust their data quality
- 78% struggle with data visualization
Real-World Impact
These challenges translate to real business problems:
- Missed Opportunities: 67% of event organizers miss revenue optimization opportunities due to delayed insights
- Poor Decision Making: 54% make decisions based on incomplete or outdated data
- Stakeholder Frustration: 71% of sponsors report dissatisfaction with reporting speed and quality
- Operational Inefficiency: 45% of event staff time spent on data compilation rather than optimization
Emerging Trends in Event Analytics
1. AI and Machine Learning
Predictive Analytics:
- Attendance forecasting with 92% accuracy
- Revenue optimization recommendations
- Risk assessment and mitigation
- Dynamic pricing suggestions
Natural Language Processing:
- Conversational analytics interfaces
- Automated report generation
- Sentiment analysis of attendee feedback
- Real-time translation of insights
2. Real-Time Intelligence
Live Dashboards:
- Sub-30-second data updates
- Mobile-optimized interfaces
- Automated alerting systems
- Multi-stakeholder access controls
Operational Intelligence:
- Crowd flow optimization
- Resource allocation recommendations
- Security threat detection
- Environmental monitoring
3. Personalization and Segmentation
Attendee Journey Mapping:
- Individual behavior tracking
- Personalized recommendations
- Predictive engagement scoring
- Dynamic content delivery
Stakeholder Customization:
- Role-based dashboards
- Custom KPI tracking
- Automated reporting schedules
- Interactive data exploration
The ROI of Modern Event Analytics
Quantifiable Benefits
Organizations implementing comprehensive analytics solutions report:
- Revenue Increase: 12-28% average lift in event revenue
- Cost Reduction: 15-35% decrease in operational costs
- Attendee Satisfaction: 18-42% improvement in satisfaction scores
- Sponsor Retention: 25-40% increase in sponsor renewal rates
- Operational Efficiency: 30-50% reduction in manual reporting time
Case Study: Major Music Festival
A leading music festival implemented comprehensive analytics and achieved:
- $2.3M additional revenue through dynamic pricing optimization
- 45% reduction in food waste through demand forecasting
- 28% increase in sponsor satisfaction scores
- 60% faster reporting to stakeholders
- 15% improvement in attendee flow management
The Future: Agentic Reporting and AI-Powered Analytics
The Next Evolution: Agentic Reporting
As the industry matures, we’re seeing the emergence of agentic reporting—a paradigm shift from reactive to proactive analytics. Unlike traditional tools that require manual queries and report generation, agentic systems use AI-powered agents that:
Continuously Monitor Data:
- Watch key metrics 24/7
- Identify anomalies and opportunities
- Trigger automated responses
- Learn from patterns and outcomes
Deliver Proactive Insights:
- Generate reports before stakeholders ask
- Provide context and recommendations
- Adapt to individual preferences
- Scale across multiple events simultaneously
Enable Real-Time Decision Making:
- Sub-minute insight delivery
- Automated alerting systems
- Predictive recommendations
- Instant stakeholder communication
Why Agentic Reporting Matters for Live Events
Live events are uniquely suited for agentic reporting because they:
Require Speed: Events happen in real-time, and decisions must be made quickly Generate Massive Data: Modern events produce terabytes of data that’s impossible to analyze manually Have Multiple Stakeholders: Sponsors, vendors, attendees, and organizers all need different insights Operate Under Pressure: Revenue opportunities are fleeting, and optimization windows are narrow
Conclusion: The Analytics Imperative
The live events industry is at a crossroads. Organizations that embrace modern analytics—especially agentic reporting—will gain significant competitive advantages:
- Faster decision-making through real-time insights
- Higher revenue through optimization opportunities
- Better stakeholder relationships through transparent reporting
- Operational efficiency through automation
- Competitive differentiation through data-driven experiences
The question isn’t whether to invest in analytics—it’s how quickly you can implement the right solution. With agentic reporting platforms like Breadcrumb, the barrier to entry has never been lower, and the potential returns have never been higher.
Ready to Transform Your Event Analytics?
Whether you’re managing a single event or a portfolio of hundreds, the right analytics solution can dramatically improve your outcomes. Start with a clear understanding of your needs, choose the right tools for your scale, and consider the long-term benefits of agentic reporting.
The future of live events is data-driven, and the future is now.
Ready to see how agentic reporting can transform your event analytics? Schedule a demo and discover how Breadcrumb can help you turn event data into actionable insights that drive real business results.