
May 12, 2025 - By: Victor Tang
The Top 3 Metrics for Live Events And How Partner Facing Teams Deliver Them Instantly
Discover the top 3 event reporting metrics partner-facing teams use to engage sponsors and stakeholders. Learn how Breadcrumb delivers instant insights on guest engagement, spend per attendee, and sponsor ROI at live events.
At today’s live events, from esports tournaments and music festivals to conferences and fan activations, data is no longer just for internal teams. It has become a vital communication tool. For those responsible for delivering performance insights to sponsors, customers, and brand partners, the pressure to tell a compelling story quickly and accurately has never been higher.
If you are the person who must prove ROI, summarize audience engagement, or justify sponsor investment, this guide is for you.
Whether your role is VP of Partnerships, Head of Operations, Brand Strategy Lead, or any partner facing operator, you likely face the same challenge. How can I get the data I need without waiting on analysts or manually wrangling spreadsheets late into the night?
In this blog, we break down the top three metrics that partner facing operators need to share at live events. We show how Breadcrumb.ai makes surfacing and delivering these insights effortless, in real time, and without technical complexity.
Why Fast, Clear Metrics Matter More Than Ever
Let’s set the stage. You’re managing relationships with sponsors, vendors, or venue partners. They want proof that their investment delivered impact:
• “How many people visited our activation?”
• “What was the average spend per guest?”
• “Can I share this performance data internally today?”
Traditionally, those answers are buried in disconnected systems: POS exports, RFID readers, QR code scans, social media tools, and manual reporting decks. The result? Delays, frustration, and missed opportunities.
Breadcrumb changes the game by giving you a real-time, AI-powered dashboard built for people like you—not data teams. Let’s walk through the three key metrics you need to deliver impact.
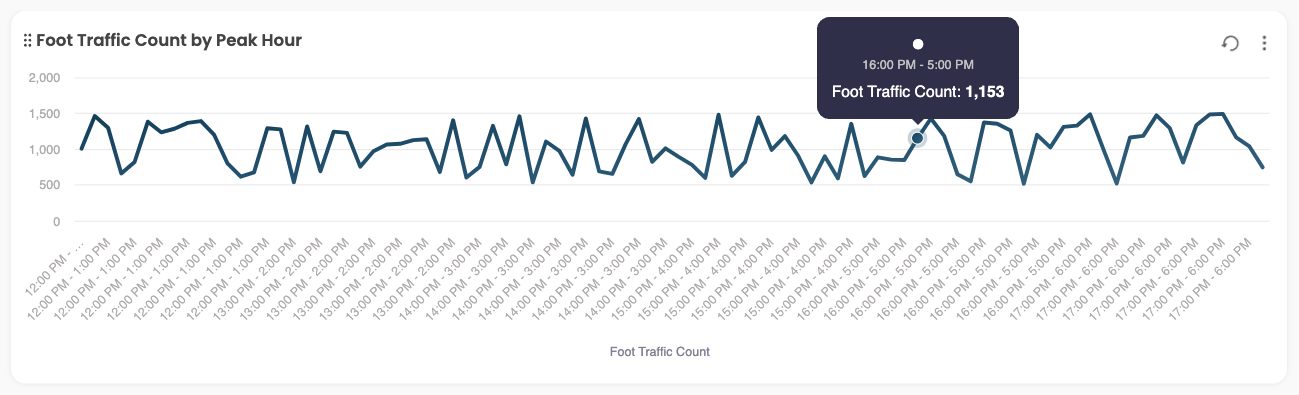
1. Guest Engagement by Location or Zone
Why it matters:
Sponsors and brand partners often invest in on-site activations or branded areas—whether it’s a VIP lounge, a photo booth, or a gaming experience. They want to know:
• Did people show up?
• How long did they stay?
• Was this space worth it?
What you need to show:
• Foot traffic per zone
• Dwell time (how long people stayed)
• Traffic trends throughout the day
• Comparative performance (e.g., Zone A vs. Zone B)
How Breadcrumb delivers it instantly:
Breadcrumb integrates with RFID tap-ins, camera counters, or Wi-Fi pings to track real-time movement. You can instantly pull up:
“How many people visited our sponsor activation between 2–5 PM?”
“Which branded area had the longest dwell time?”
These metrics help your partners see impact immediately, and let you pivot mid-event if certain areas underperform.
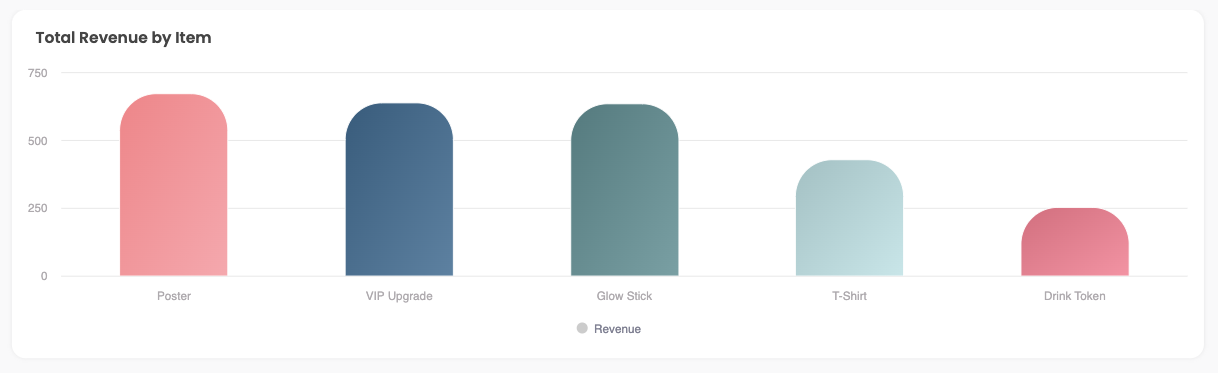
2. Spend Per Attendee (and Revenue by Segment)
Why it matters:
Sponsors and stakeholders aren’t just looking for foot traffic—they want proof that the audience had buying power and intent. As the partner-facing operator, you’re expected to demonstrate:
• How much did attendees spend?
• What drove the most revenue?
• Which audience segments were most valuable?
What you need to show:
• Average spend per attendee
• Revenue breakdown by product or zone (e.g. food, merch, VIP upgrades)
• Differences between segments (e.g. VIP vs General Admission)
How Breadcrumb delivers it instantly:
Breadcrumb connects to your POS and ticketing systems, automatically calculates per-capita spend, and enriches the data by segment. You don’t need to do any manual merging.
You can ask:
“What’s the average spend for VIP ticket holders today?”
“Which merch item generated the most revenue between 6–9 PM?”
Now you’re able to share clear, meaningful financial metrics with stakeholders before the event even ends.
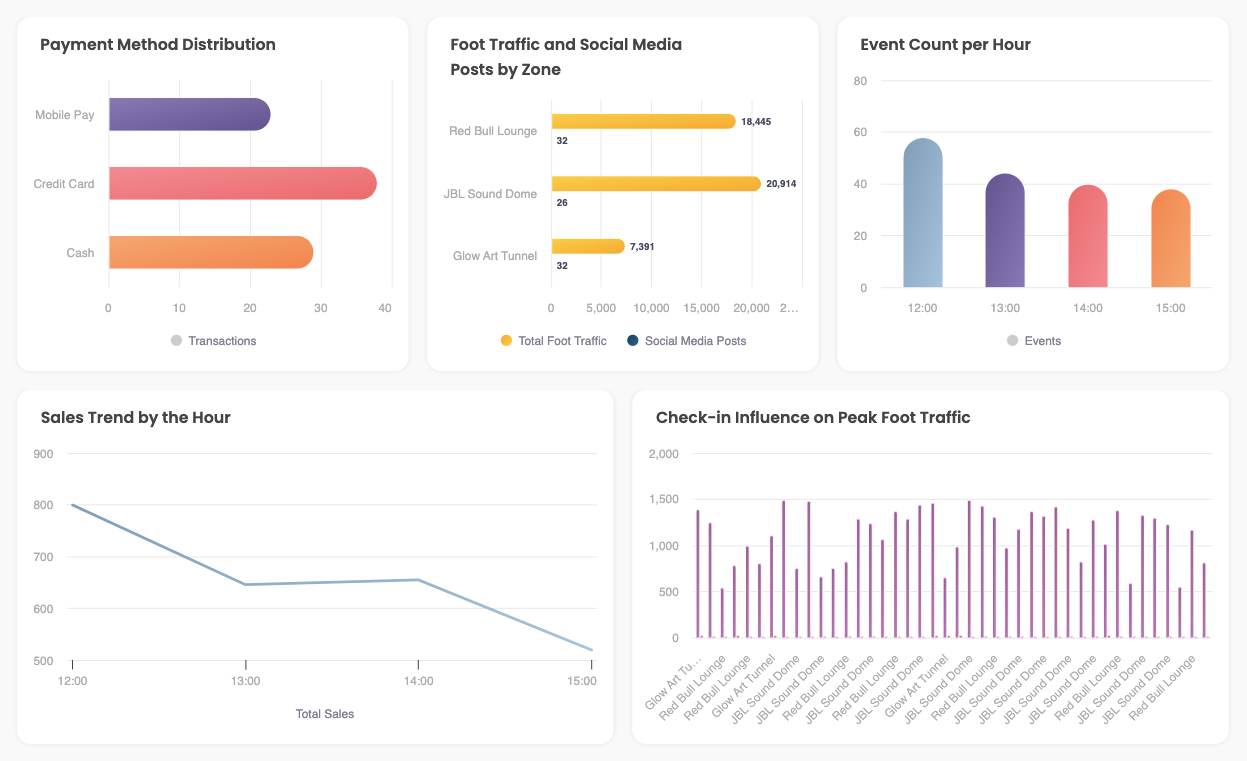
3. Sponsor Activation ROI
Why it matters:
This is the big one. Sponsors want measurable outcomes. Not just impressions—but engagement, interest, and lead generation. They want to walk away from your event feeling like it was a smart business decision.
As the person reporting back, your job is to show:
• The audience interacted with the brand
• Engagement was high-quality (not just a passing glance)
• There’s proof of outcomes (scans, clicks, signups, etc.)
What you need to show:
• Visitors to sponsor zones
• Average dwell time
• QR scans, email signups, app downloads
• Social mentions and on-site content sharing
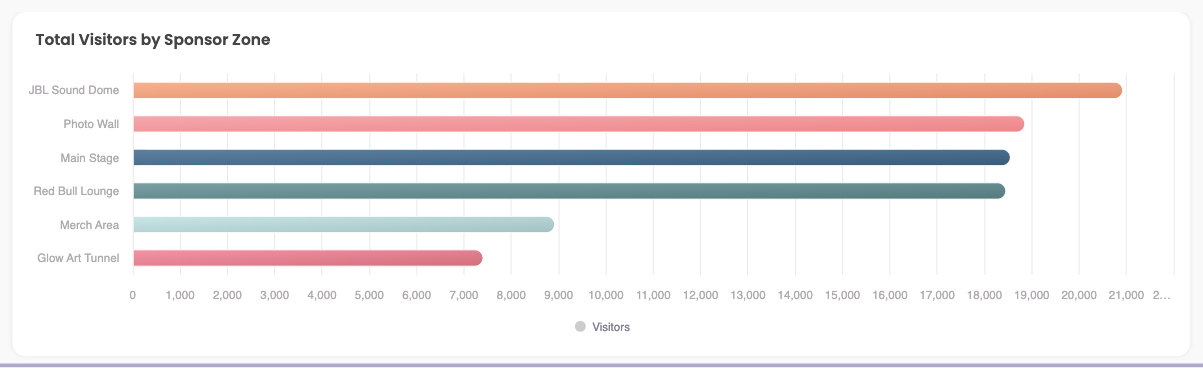
How Breadcrumb delivers it instantly:
Breadcrumb gives each sponsor their own real-time dashboard with only their data. You can pre-set key KPIs or let them ask questions like:
“How many guests interacted with our brand booth today?”
“Did dwell time improve after we launched the afternoon giveaway?”
Now your sponsors feel seen, supported, and satisfied. And you look like a rockstar for making it so easy.
How Breadcrumb Helps Partner-Facing Teams Win
You’re not a data analyst—but you’re expected to deliver data.
Breadcrumb makes that possible with:
• AI-generated dashboards that update in real time
• Natural language querying so you can just type a question
• Audience segmentation tied to real revenue metrics
• Auto-generated reports that can be shared internally or externally
• Sponsor-specific views so they only see what matters to them
Whether you’re in charge of partnerships, operations, or customer success, Breadcrumb is your secret weapon for turning complex event data into actionable insights—instantly.
Wrapping Up: Metrics That Matter, When They Matter
If you’re the person on-site or post-event responsible for telling the story—the person who makes partners, sponsors, and stakeholders feel confident in their investment—you need fast, accurate, and shareable metrics.
These three are your holy grail:
-
Guest Engagement by Zone
-
Spend Per Attendee
-
Sponsor Activation ROI
With Breadcrumb, you no longer have to wait for the data team. You are the data team.
Ready to Share the Right Insights Instantly?
Whether you’re planning a music festival, esports tournament, or branded fan zone, Breadcrumb can help you turn data into meaningful stories your partners will love.
👉 Book a demo and see how easy it is to create dashboards that answer stakeholder questions before they even ask.