December 29, 2025 - By: Victor Tang
Smarter Data Setup, Better Context and Display
Manage data sources in a cleaner modal, expand tables to full screen, and define custom semantics right at the source for faster, more accurate insights.
We made it easier to manage data sources and understand what they mean, without leaving your space. This update focuses on the parts of your workflow that slow teams down most: switching sources, validating raw data, and aligning on definitions before insights are generated.
If you manage multiple dashboards or regularly refresh datasets, these changes reduce the number of clicks and help you move from connection to clarity much faster.
What’s New
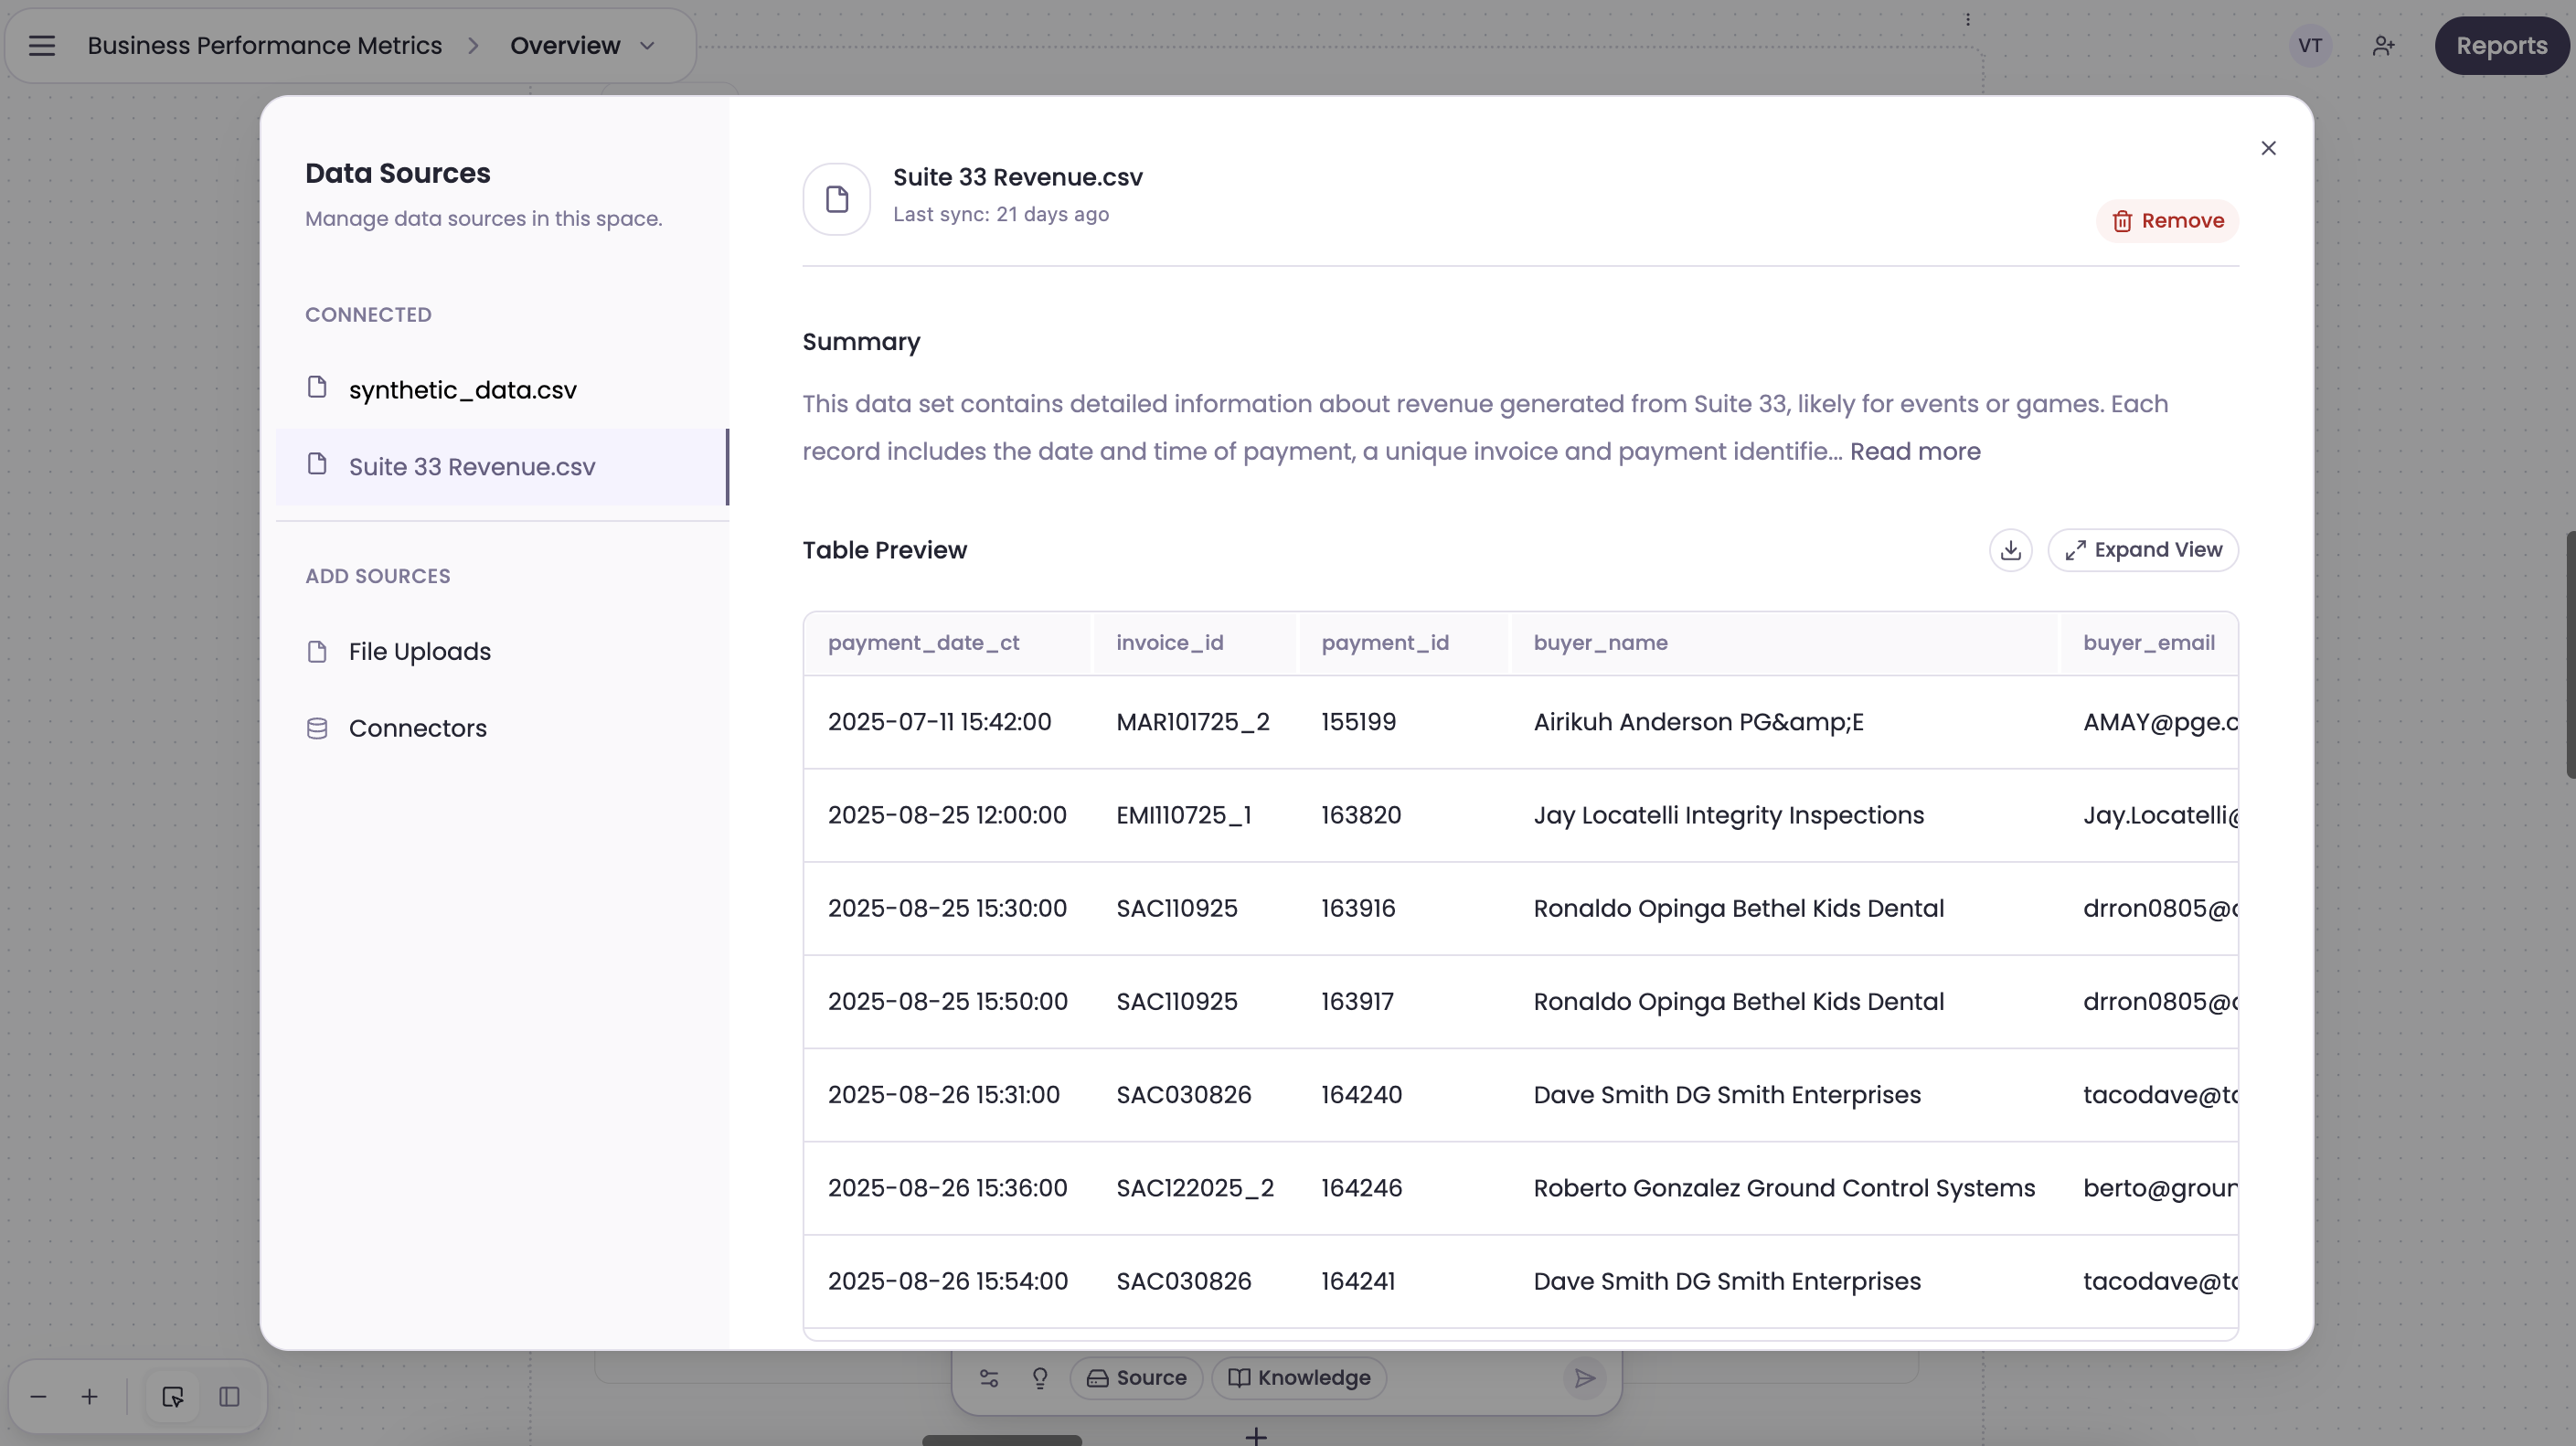
New source modal display
Add, remove, and swap sources in a single, clearer modal. Quickly see what is connected and make changes without jumping between settings. The modal highlights what is active, what is available, and what will update downstream before you confirm.
Easier source management inside a space
Remove or add sources directly from the space view so you can keep dashboards aligned as your data evolves. This is especially useful when you are iterating on a client report, switching between sandboxes, or cleaning up a temporary source after a project ends.
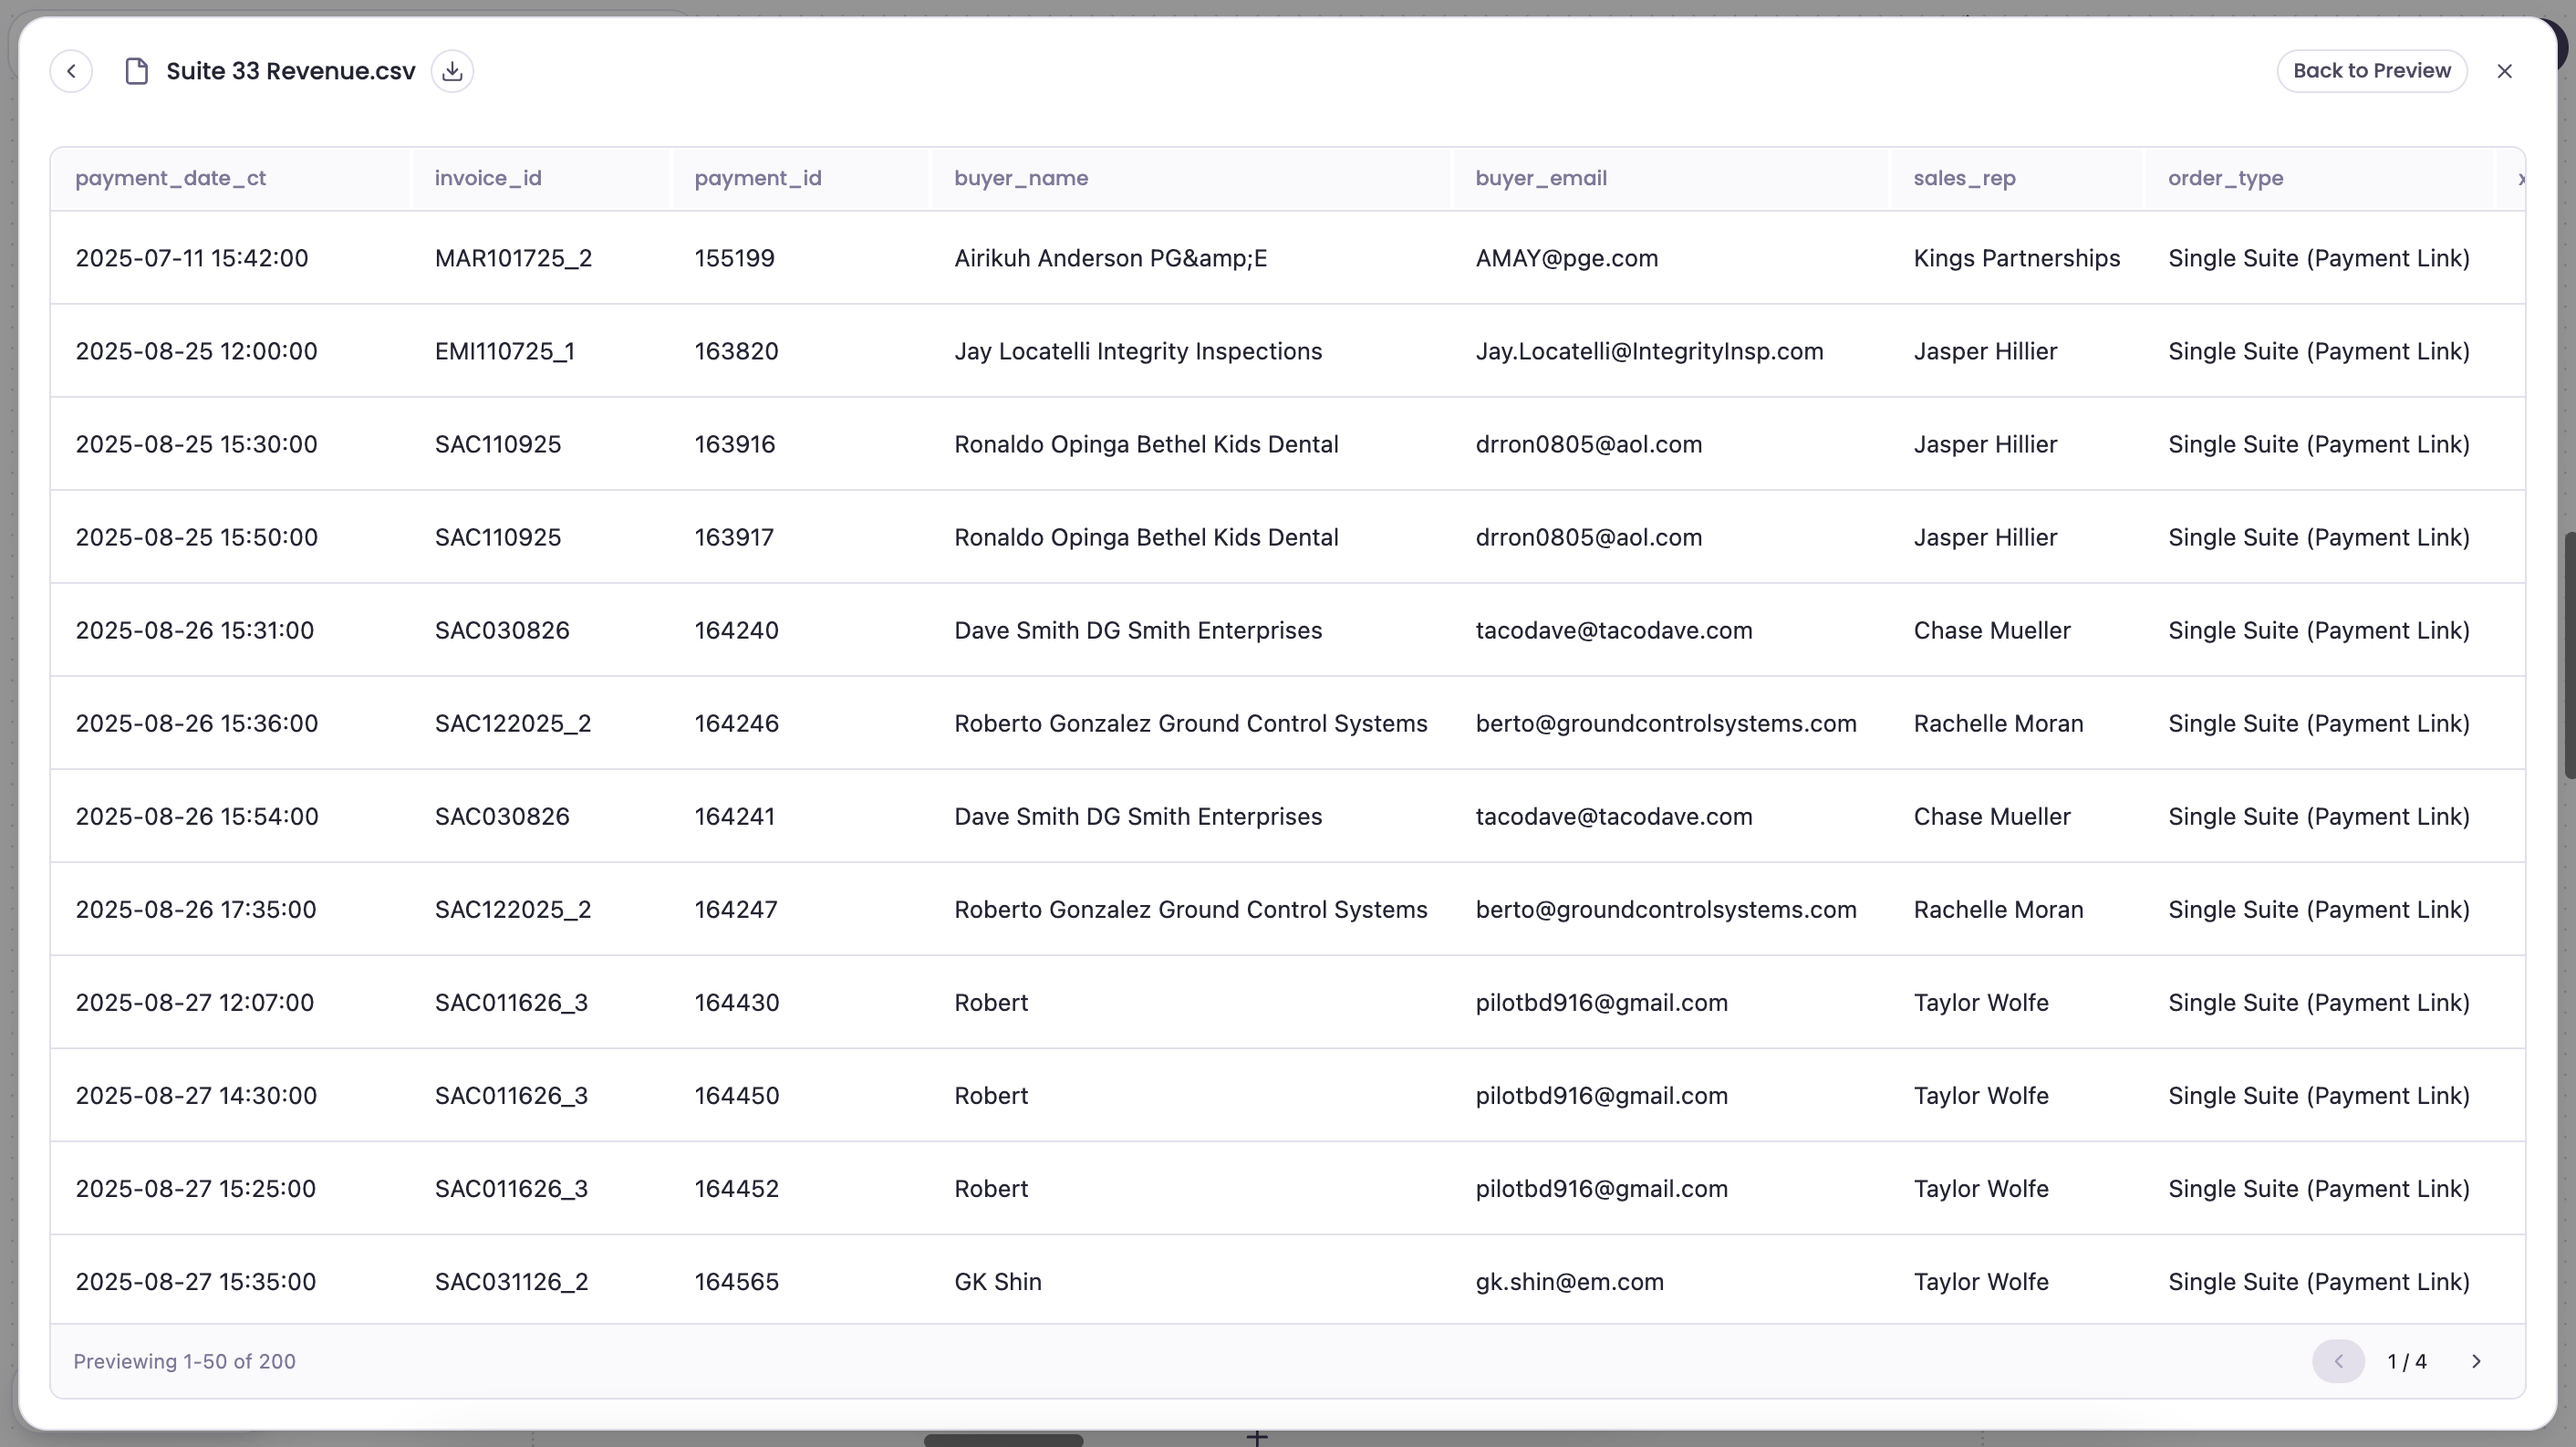
Full-screen expanded table view
Open any table in a full-screen view for faster scanning, easier filtering, and more room for wide schemas. Compare columns side by side, scroll comfortably across large datasets, and spot data issues before they reach a chart.
Custom semantics at the source
Define custom semantics directly on the data source so AI and teammates understand fields the same way (for example, “ARR”, “Net Revenue”, or “Tickets Sold”). This gives you consistent metrics across dashboards and reduces the time spent re-explaining field meaning in each analysis.
Why It Matters
Source management and data clarity are the foundation of reliable analytics. When sources are easy to update, teams can keep dashboards current without rebuilding. When semantics are defined at the source, every report and AI-generated insight uses the same definitions, which improves trust and speeds up decision-making.
These changes are designed to help teams:
- Keep dashboards accurate as datasets change
- Validate raw data faster before building visualizations
- Standardize definitions across teams and clients
- Reduce back-and-forth on metric interpretation
How Teams Are Using It
- Agency reporting: Swap in a new client data source without rebuilding a space.
- Ops reviews: Expand tables to full screen to verify inputs before sharing weekly metrics.
- Product analytics: Define custom semantics for revenue, retention, or activation events so every insight stays consistent.
- Data cleanup: Remove stale sources from a space in seconds to keep the workspace focused.
Log in to Breadcrumb to try the updates now.