August 21, 2025 - By: Victor Tang
How to Prepare Your Spreadsheet for Data Analysis
Learn what raw data table format means, why it's crucial for spreadsheet uploads, and how AI-powered tools like Breadcrumb automatically clean your data for better analytics.
Spreadsheets are one of the most common tools used in business today. Whether you are managing event registrations, tracking sales, or keeping records of customer feedback, chances are much of your data starts in Excel or Google Sheets. However, not every spreadsheet is created equal. Some are designed for presentation, some for quick calculations, and others are simply copied together from multiple sources.
When it comes to uploading spreadsheets into a data platform like Breadcrumb or any AI-powered analytics tool, the way your spreadsheet is structured can make the difference between a smooth upload and a frustrating error. The concept that underpins this process is called raw data table format.
In this article, we will explain what raw data table format means, why it is important, how our AI helps with cleaning, and how you can prepare your spreadsheets to ensure they work well with automated analytics platforms.
What is Raw Data Table Format?
A raw data table format is a clean, consistent, and machine-readable layout of your spreadsheet data. It is not about how pretty the spreadsheet looks, but how logically it is structured for computers to understand.
In simple terms, raw data table format means:
- Each row represents one observation, record, or transaction.
- Each column represents one variable, attribute, or field.
- The first row is reserved for column headers (titles for your fields).
- There are no extra merged cells, blank rows, or decorative formatting interfering with the structure.
Think of it as your spreadsheet in its simplest form, stripped of unnecessary styling or human-friendly presentation features.
Why Formatting Matters for Uploads
When you upload a spreadsheet to Breadcrumb, the system reads your file line by line. If your headers are missing, your rows contain inconsistent information, or there are stray formatting quirks, the AI has to spend extra effort guessing what you meant.
Most of the time, the AI will attempt to clean and prepare your file for analysis automatically. However, in certain cases the process can fail. When this happens, you may see errors during upload or notice that your charts and reports are not displaying the right values.
By preparing your data in a raw table format, you make it easier for the system to parse, process, and deliver accurate insights without errors.
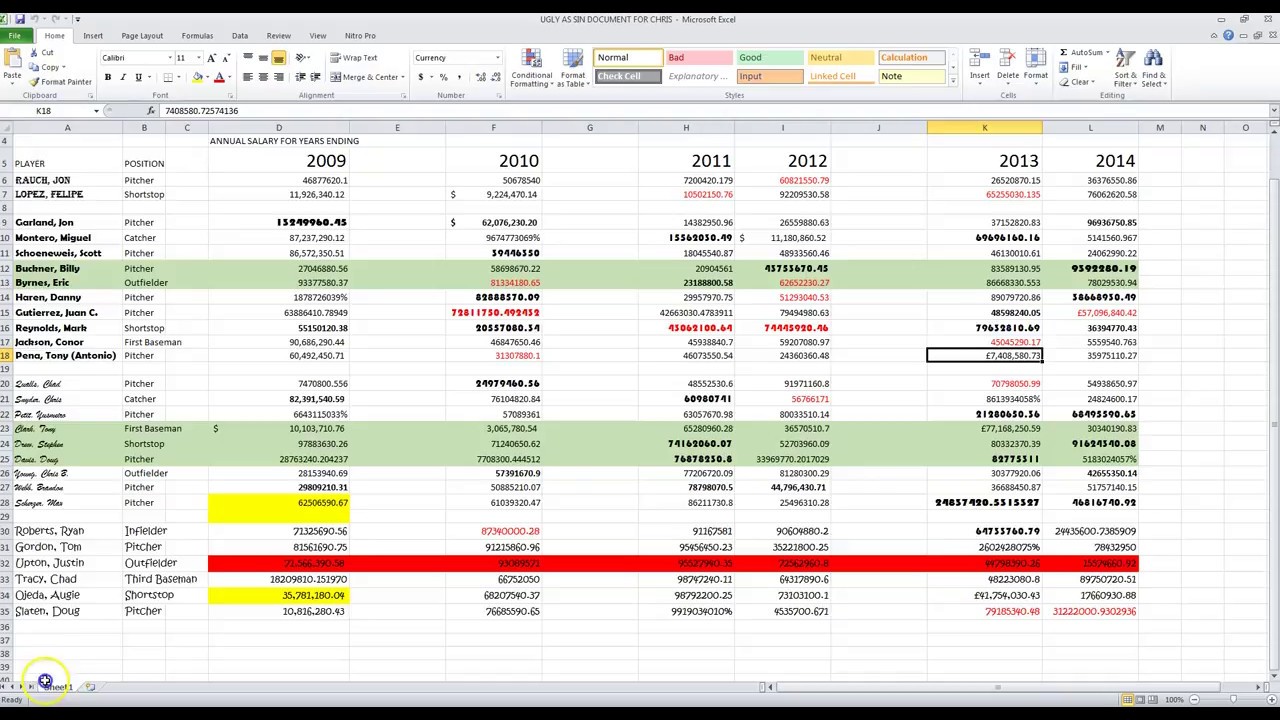
Common Problems With Spreadsheet Uploads
Here are the most common reasons why spreadsheet uploads fail or produce inaccurate results:
1. Blank Rows and Columns
Many people leave empty rows to visually separate sections of data. While this looks fine to the human eye, an AI system sees it as missing information, which can break the structure of the dataset.
2. Merged Cells in Headers
Sometimes column names are spread across multiple merged cells to make them look nice. Unfortunately, this confuses systems that expect one header per column.
3. Mixed Data Types in the Same Column
For example, if you have a “Quantity” column where some rows contain numbers like 25 and others contain text like “twenty-five,” the system cannot decide how to interpret the field. Consistency is key.
4. Special Characters in Headers
Headers that contain characters such as slashes, parentheses, or emojis may look creative, but they can cause parsing issues. Stick to simple text without special symbols.
5. Visualizations, Formulas, or Scattered Tables
A common mistake is uploading a spreadsheet that contains:
- Pivot tables or charts built into the sheet
- Formula cells that reference other sheets or columns
- Multiple small tables placed in different areas of the sheet
While these elements are great for presentations or internal analysis, they are problematic for uploading.
Why? Because the system expects one continuous table of raw data, not a mixture of tables, formulas, and charts. If your sheet contains multiple disconnected sections, Breadcrumb’s AI cannot reliably determine which one represents the “real” dataset.
The solution is simple: keep a raw version of your data table for uploads, and save the charts or formulas in a separate version meant for presentations.
6. Files Saved in the Wrong Format
Even if your spreadsheet looks perfect, saving it in an outdated file type like .xls or a proprietary format may prevent the platform from reading it correctly. Always use .xlsx or .csv.
How Our AI Cleans Your Data Automatically
The good news is that your file does not have to be “perfectly cleaned” before uploading. Breadcrumb’s AI is designed to automatically detect and fix many common formatting issues so you can spend less time scrubbing spreadsheets and more time analyzing insights.
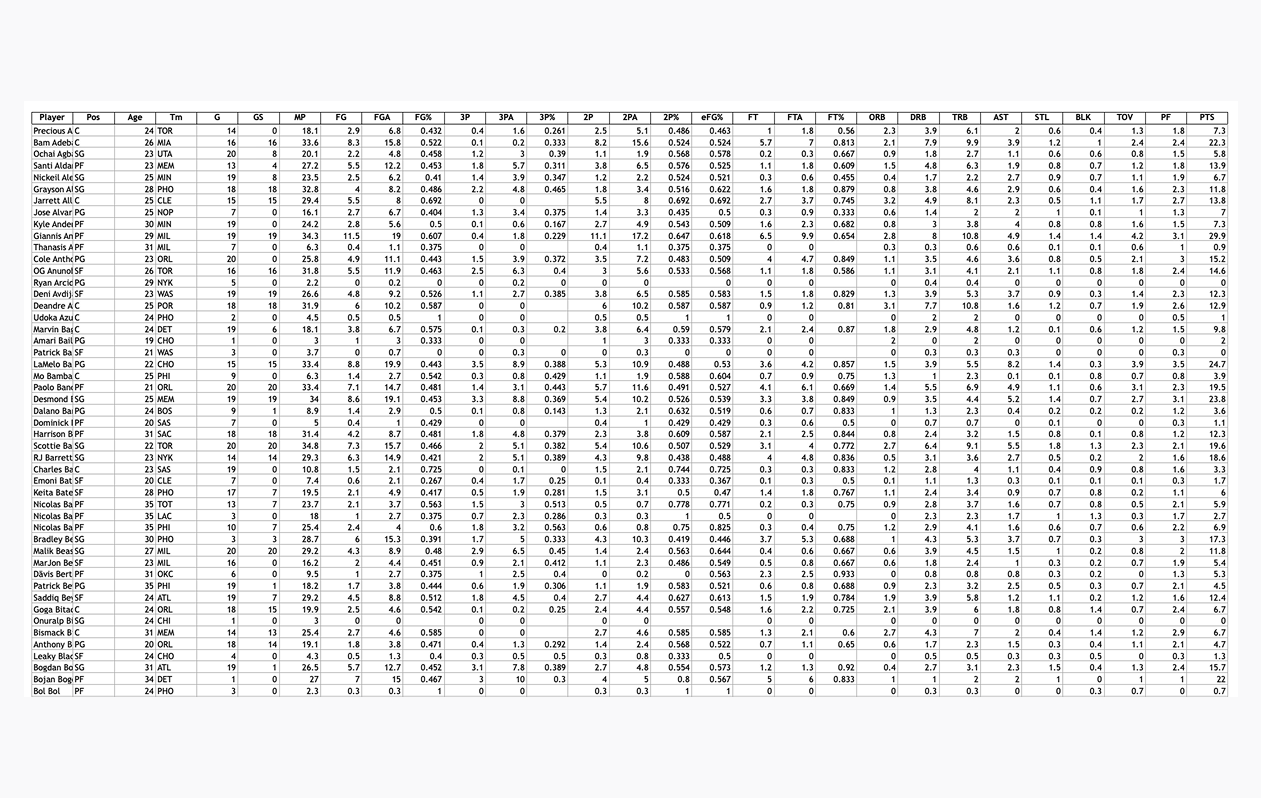
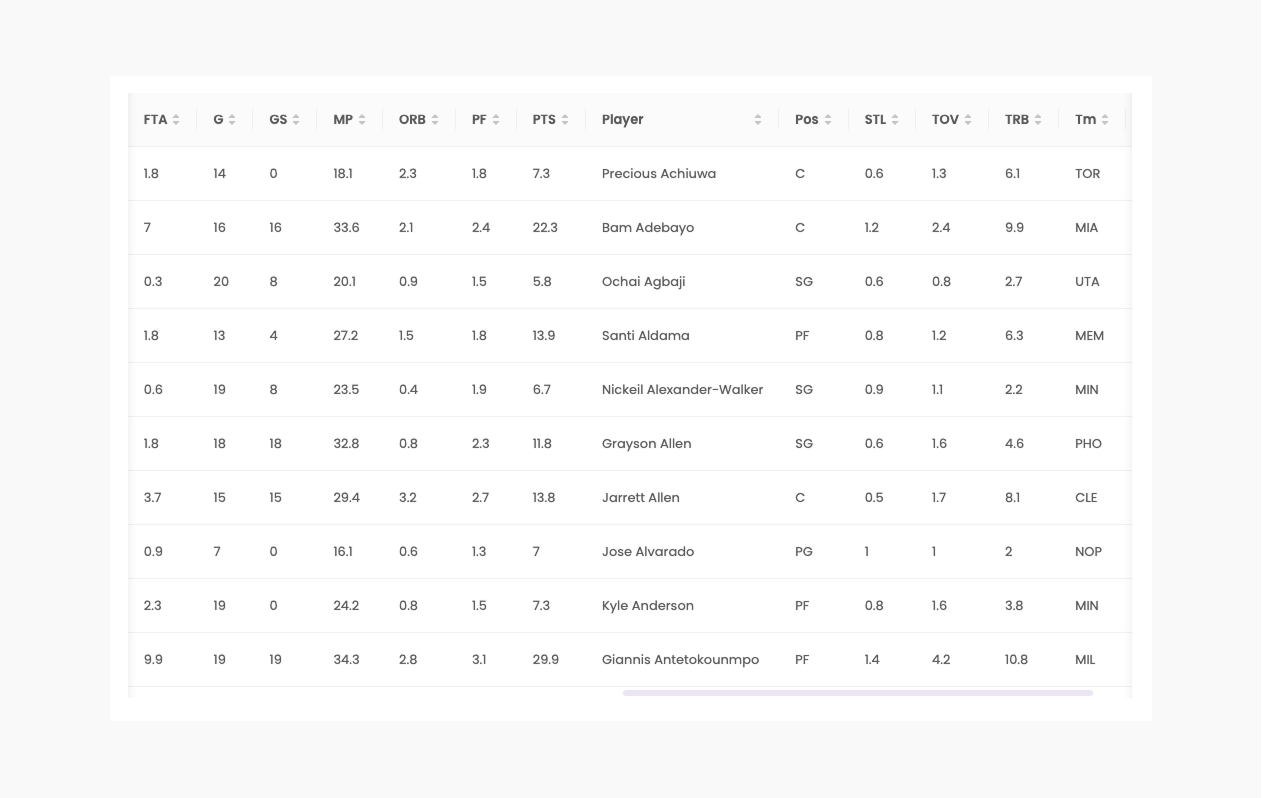
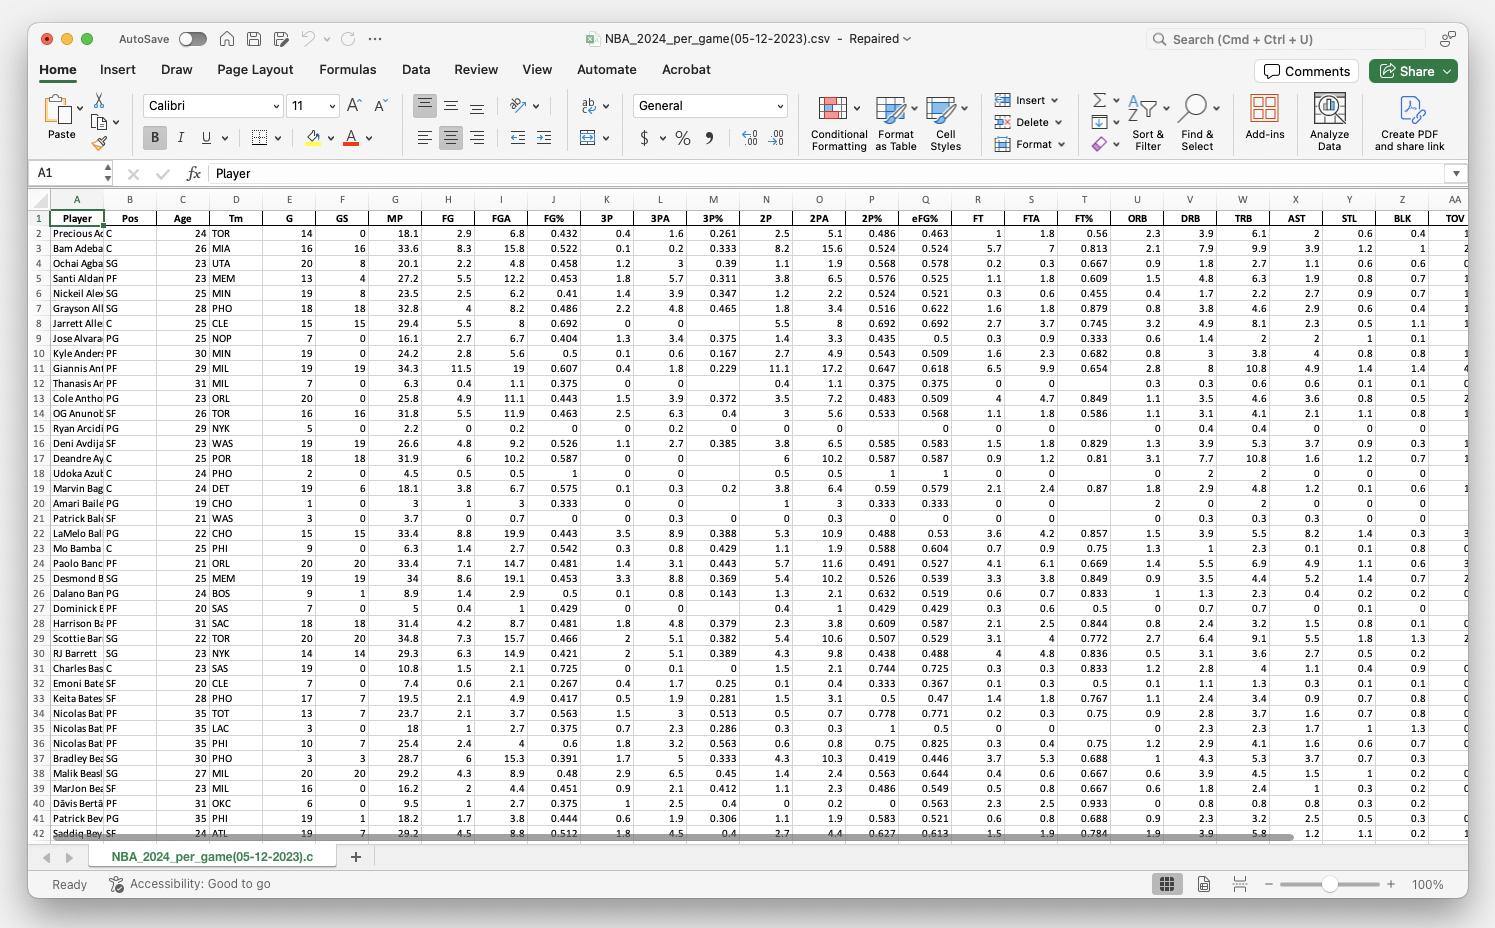
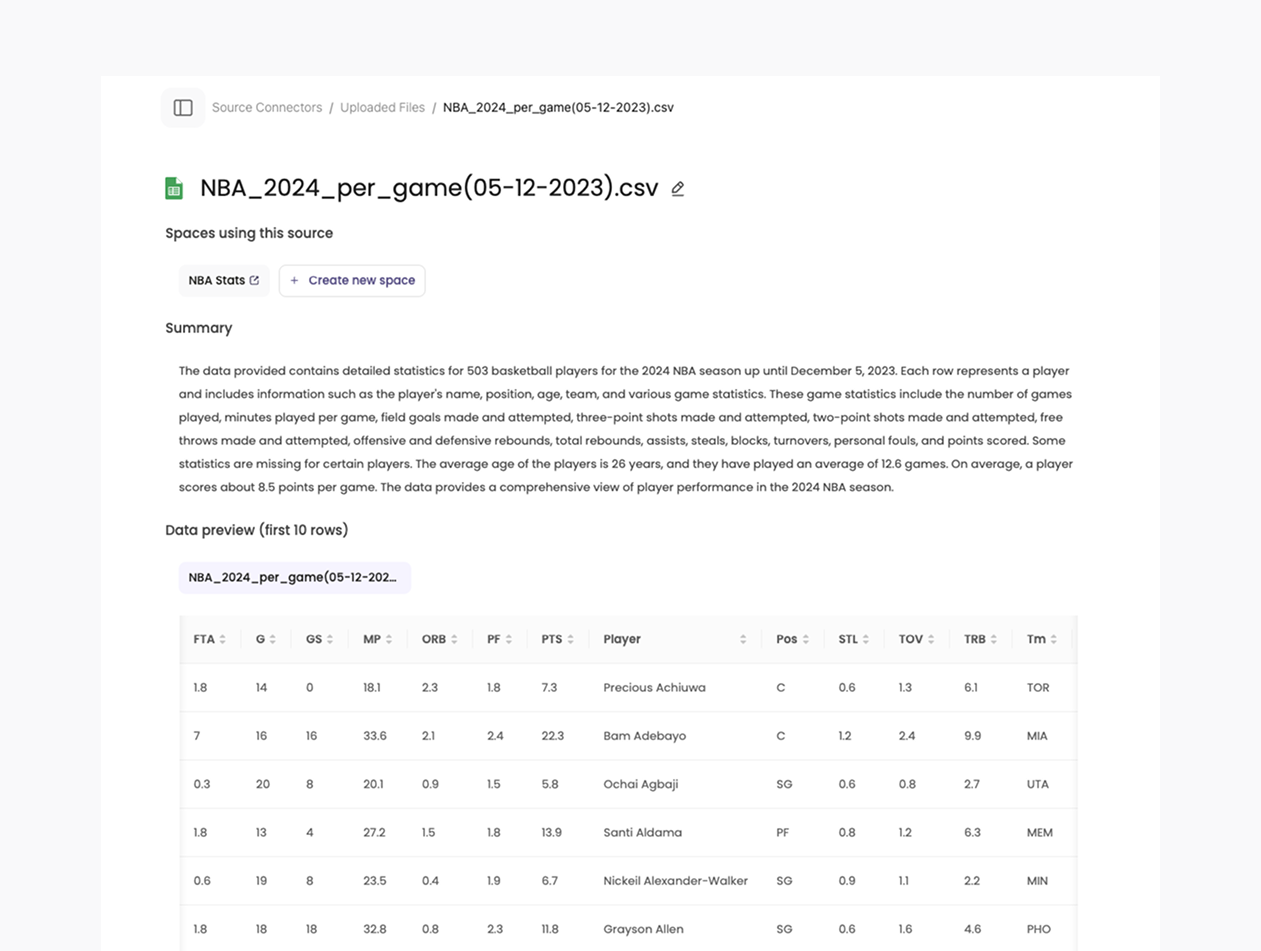
Here’s an example of what a well-formatted data table looks like:
Here are a few examples of how our AI helps:
Column Name Formatting
- All column names are standardized to use lowercase letters and underscores.
- For example, “Life_expectancy” becomes
life_expectancyand “Thinness__1-19_years” becomesthinness__1_19_years. - Any special characters or spaces are replaced with underscores.
- If a column name is longer than 63 characters, it is shortened automatically so it will still work in databases and dashboards.
Integer Columns Handling
- Columns that contain whole numbers, like “Year” or “Sales,” are cleaned so that missing values are stored as blank (null) instead of random placeholders like NaN.
- This prevents errors when performing calculations or aggregations.
Text Columns Cleaning
- Columns containing text, such as “Customer Name” or “Country,” have extra spaces removed from the beginning or end of the values.
- This avoids issues when filtering, searching, or grouping by text.
No Rows or Columns Removed
- Our AI never deletes your original information. All data rows and columns are preserved during cleaning.
In summary, the AI prepares your file for easy use in databases and dashboards by:
- Making column names consistent
- Handling missing values correctly
- Cleaning text entries
- Preserving all original data
This means you do not need to obsess over formatting every detail. As long as your file follows the general structure of raw data tables, Breadcrumb’s AI will handle the fine-tuning.
How to Prepare Your Spreadsheet in Raw Data Table Format
Even though our AI does a lot of the cleaning automatically, you can make uploads smoother by following these steps:
- Remove Blank Rows and Columns - Delete any extra rows or columns that are not part of your dataset.
- Set Headers in the First Row - Always use the first row for column names, with no merged cells.
- Keep Data Consistent in Each Column - Stick to one format per column, such as numbers for “Sales” or text for “Region.”
- Avoid Charts, Formulas, and Multiple Tables - Keep the upload sheet as a single clean table without extras.
- Simplify Your Headers - Use clear and short labels without special symbols.
- Save as .xlsx or .csv - These formats are the most reliable for uploading.
Examples: What Works and What Doesn’t
Bad Example (Not Raw Data Table Format):
- Title row above the table: “Sales Report Q2 2024”
- Merged header cells like “Customer Information” spanning across multiple columns
- Blank rows separating regions
- A “Sales” column mixing numbers, text, and currency symbols
- Pivot charts and calculated columns mixed into the same sheet
- Multiple tables scattered across the same file
- Saved as .xls
Good Example (Raw Data Table Format):
- First row has headers like “Customer Name,” “Region,” “Product,” “Sales”
- Each row represents one transaction
- No blank rows or merged cells
- All “Sales” values are clean numbers only
- No charts, formulas, or separate tables cluttering the sheet
- Saved as .xlsx
Benefits of Using Raw Data Table Format
When you combine raw data formatting with Breadcrumb’s AI cleaning, you get the best results:
- Faster uploads: Clean structure plus AI adjustments mean quick processing.
- Accurate insights: Your data is standardized before analysis.
- Less manual work: The AI handles the small details so you don’t have to.
- Scalable workflows: Uploads remain consistent even as datasets grow.
Final Thoughts
Raw data table format may sound technical, but it is simply a clean way to organize spreadsheets so computers can read them. And the good news is you do not have to be perfect. Breadcrumb’s AI automatically standardizes column names, handles missing values, and cleans text fields for you.
The best approach is to follow the general structure of raw data tables and avoid pitfalls like extra visualizations, formulas, or scattered tables. Then let the AI do the rest. This saves you time, reduces errors, and ensures your analytics are always ready to go.
By combining good spreadsheet habits with AI cleaning, you unlock a smoother path to accurate insights and data-driven decision-making.