October 31, 2025 - By: Ryan Dao
Data Preparation for AI Agents: A Complete Guide to Preparing Data for Agentic Reporting
Master data preparation for AI agents and agentic reporting. Learn data standardization, business context definition, and best practices to enable AI-powered reporting agents to deliver trustworthy insights without expensive data warehouses.
Agentic reporting uses AI-powered reporting agents to watch your most important metrics, unify data from multiple sources, and deliver narrative insights your stakeholders can explore without waiting on an analyst or wrestling with a BI tool.
Read more: What is Agentic Reporting?
Agentic reporting and why it matters
- Faster decisions: Agents surface timely “what changed and why” narratives the moment thresholds are crossed.
- Lower cost to scale: Replace repetitive reporting work with reusable, adaptive templates and always‑on agents.
- Personalization at scale: Tailor insights to each customer and stakeholder without maintaining dozens of dashboard variants.
- Self-service exploration: Business users can explore narratives, drill into drivers, and ask follow-up questions without waiting on analysts or learning SQL.
AI Agents do the data work. Your job is to provide clean inputs and clear business contexts.
What “Good Data for AI Agents” Looks Like
You don’t need a perfect data warehouse. AI agents excel at handling messy data as long as the data and context are well-prepped. All you really need are two things: light standardization and clear, plain-English business contexts.
Light Data Standardization: Consistency Over Perfection
- Use consistent IDs across data sources: Keep
customer_id,account_id, andproduct_skuuniform across Salesforce, databases, and spreadsheets. - Adopt predictable naming conventions: They should be intuitive enough to work, but not so rigid that they slow you down. Example: you don’t need to give every NFL team an ID; just keep their names consistent (e.g., “Los Angeles Rams”, not “LA Rams”).
- Keep time periods consistent: Don’t mix weekly signups with daily revenue in your data analysis. Ensure comparable time granularity across datasets.
- Structure and update cadence: Update spreadsheets at the same frequency as database syncs (daily, weekly) so agents don’t compare stale data with fresh data.
Plain-English Business Context: The Foundation of Trustworthy AI
Business context is what separates accurate AI insights from hallucinations. When you provide clear, natural-language explanations of your data and business rules, AI agents interpret your metrics the way your team does—not according to their own assumptions.
- Make context first-class: Provide the “rules of your business” in natural language so agents interpret data consistently with your team’s understanding.
- Explain only the non-obvious: In an order table,
customer_idis self-explanatory. Butcreated_atcould mean when the order was created, when payment cleared, or when it was fulfilled. Spell it out. - Define calculation rules explicitly: Avoid ambiguity in formulas. Write “Gross Margin = (Revenue − COGS) ÷ Revenue” or “Churn includes voluntary cancellations but excludes non-payment suspensions.”
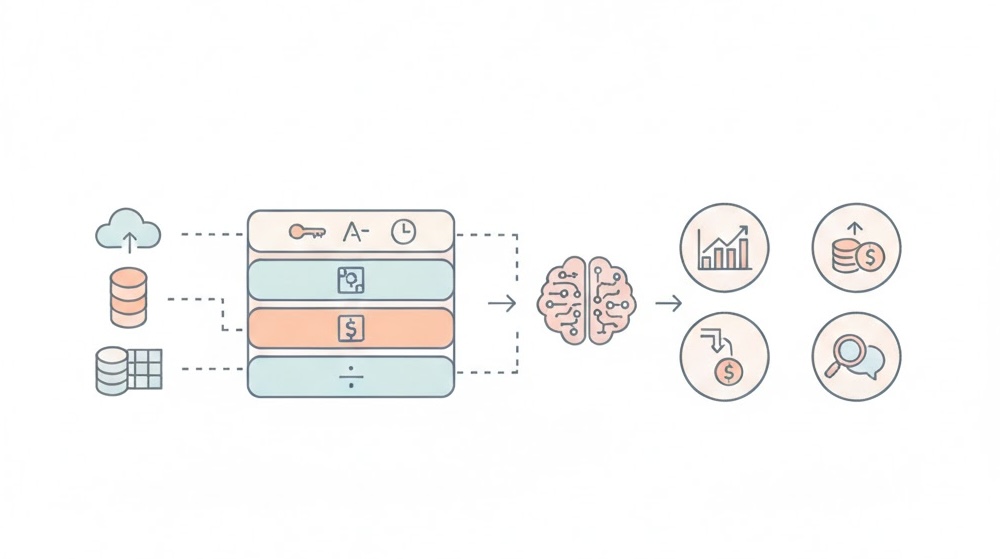
Three-Layer Data Preparation Framework for AI Agents
Layer 1: Light Standardization Across Data Sources
Agents work best when data from spreadsheets, SaaS apps, and databases share a common structure. Here’s how:
- Consistent identifiers: Use the same
customer_id,account_id, orproduct_skuacross Salesforce, your data warehouse, and Google Sheets. - Common naming conventions: If Salesforce calls it “Account Name” and your database calls it “company_name”, pick one standard or document the mapping clearly.
- Predictable update cadence: Update spreadsheets at the same frequency as database syncs (daily, weekly) so AI agents don’t flag false anomalies from timing mismatches.
- Unit consistency: Use the same currency (USD vs. EUR), region names (New York vs. NY), measurement units, and date formats across all sources.
Key Principle: You don’t need perfect ETL pipelines or data warehouses, just enough alignment that an AI agent can join and compare data without guessing at transformations.
Layer 2: Non-Obvious Data Definitions
Clarify fields that could mean multiple things. AI agents will interpret ambiguous fields incorrectly.
created_atin orders table = when the customer clicked “Place Order” (not when payment cleared or when we shipped)
amount= payment amount after discounts and credits, but before taxes and shipping
regionin sales table = sales territory (West, East, Central), not the customer’s physical location
statusin deals table = stage in your sales process (not opportunity or probability); “Won” means revenue recognized
Layer 3: Definition of Business Terms and Metrics
Define metrics and segments the way your team actually uses them—not how a database schema suggests they should be defined:
Active customer: Any customer with at least one completed order in the last 90 days
Churn: Voluntary cancellations only. Excludes non-payment suspensions, trial expirations, and downgrades to free plans.
Gross Margin: (Revenue − COGS) ÷ Revenue. COGS includes product cost and shipping, but not marketing spend or overhead.
Enterprise deal: Any contract ≥ $50K annual contract value (ACV), regardless of seat count or number of business units
Layer 4: Custom AI Instructions for Analysis and Presentation
Tell agents how to analyze and present data for your business context:
When calculating win rate: Exclude deals marked “duplicate,” “test,” or “practice” in the CRM; include only legitimate sales opportunities
When comparing time periods: Always use same-weekday comparisons (e.g., this Tuesday vs. last Tuesday, not last Monday) to account for day-of-week seasonality
For month-over-month seasonality analysis: Compare current month to same month last year, not to last month, to reflect true growth trends
When explaining revenue drops: Break down by product line first, then by region, then by customer segment to isolate the root cause
Anomaly thresholds: Flag any week-over-week revenue change > 10%, customer churn spike > 5 accounts/week, or support ticket volume increase > 20%
With these clear layers, AI agents interpret your data the way your team would, without needing a human analyst to translate every question.
Practical Example: Preparing Multi-Source Data for AI Reporting
Let’s say you have:
- Salesforce CRM: Customer names, deal values, close dates
- Stripe/PayPal: Transaction amounts and payment status
- Google Sheets: Manual cost-of-goods-sold (COGS) updates
- Mixpanel/Amplitude: Product usage and engagement metrics
Without preparation: An AI agent might report conflicting metrics—using Salesforce close dates for revenue, but Stripe payment dates, leading to date mismatches and incorrect trends.
With proper data preparation:
- Standardize IDs: Map Salesforce
account_idto Stripecustomer_idto Google Sheetscompany_code - Define “revenue”: “Revenue = Stripe payment amount (settled), matched to Salesforce close date, attributed to Stripe customer billing address region”
- Set cadence: Update Google Sheets COGS daily (aligned with Stripe syncs), not monthly
- Provide context: “Active product users = Mixpanel events in last 7 days (not last 30 days, as we define weekly retention)”
Now your AI agent can confidently join data, calculate metrics, and explain trends without ambiguity.
Common Pitfalls to Avoid When Preparing Data for AI
Pitfall 1: Over-engineering standardization
- ❌ Don’t: Spend months building perfect ETL pipelines before you start using AI agents
- ✅ Do: Get 80% of standardization in place, then iterate based on what agents actually need
Pitfall 2: Assuming AI agents “just know” your business
- ❌ Don’t: Skip context documentation, assuming AI will figure out what “Active customer” means
- ✅ Do: Write plain-English definitions upfront; it’s faster than debugging wrong insights later
Pitfall 3: Mixing time granularities
- ❌ Don’t: Compare daily revenue to weekly signups in the same report
- ✅ Do: Agree on time periods upfront—daily, weekly, or monthly—and stick to it
Pitfall 4: Forgetting about change management
- ❌ Don’t: Change data definitions or structures without telling your agents (or your team)
- ✅ Do: Version your business rules and document changes so insights remain consistent and explainable
How Breadcrumb.ai Simplifies Data Preparation for AI Agents
At Breadcrumb.ai, we’ve built AI agents that work with data as it exists in your organization, not how it theoretically should be structured.
Our platform:
- Handles multi-source data: Unify Salesforce, databases, spreadsheets, and SaaS APIs without extensive ETL
- Understands business context: Store your metric definitions, calculation rules, and analytical instructions alongside your data
- Delivers trustworthy insights: Built-in AI safeguards ensure agents respect your data rules and don’t hallucinate definitions
- Scales as you grow: Start with basic standardization; refine context as your team discovers what matters most
Learn more about how to prepare spreadsheets for data analysis or explore our complete guide to agentic reporting.
Key Takeaways: Data Preparation Best Practices
✅ Good data for AI agents isn’t about perfection—it’s about clarity and consistency.
✅ Light standardization works: Consistent IDs, naming, time periods, and units across data sources give AI agents what they need.
✅ Business context is critical: Define metrics, explain non-obvious fields, and spell out calculation rules in plain English.
✅ Start simple, iterate: You don’t need a perfect data warehouse. Get your data 80% ready, provide clear context, and refine based on what your AI agents discover.
✅ Version and document your rules: As your business evolves, keep your data definitions and AI instructions updated so insights stay consistent and trustworthy.
Conclusion
Agentic reporting makes data work simple, even for the most complex reporting use cases. You don’t need a perfect warehouse, a team of data engineers, or months of ETL work. What you do need is light standardization and clear business context.
Once your data and context are aligned, AI agents can unify, analyze, and narrate your data automatically, delivering insights your whole team can trust and act on instantly.
Ready to see data preparation in action? 👉 Schedule a demo